Statistics Class 11 Formulas & Notes
Chapter 15 Statistics Formulas
11th-grade students looking for an 11th grade NCERT notes in Math Chapter 15, i.e. Statistics. Statistics is a very important chapter in CBSE Class 11. In this article, candidates can find the NCERT notes to Class 11 Math Chapter 15. These notes are provided by Vidyakul's top academic experts. Our experts have explained the notes step by step.
When students understand the theory behind concepts related to statistics in this chapter, they will be able to solve text questions and NCERT exercises. If you get stuck somewhere while solving these NCERT problems, see Chapter 15 "NCERT notes for 11th Grade Math" included in this article.
MATHEMATICS NOTES CHAPTER-14
Points to Remember
Limit of the Class:
The starting and end values of each class are called the Lower and Upper limit.
Class Interval:
The difference between upper and lower boundary of a class is called class interval or size of the class.
Primary and Secondary Data:
The data collected by the investigator himself is known as the primary data, while the data collected by a person, other than the investigator is known as the secondary data.
Variable or Variate: A characteristics that vary in magnitude from observation to observation. E.g., weight, height, age, etc., are variables.
Frequency: The number of time an observation occurs in the given data, is called the frequency of the observation.
Discrete Frequency Distribution: A frequency distribution is called a discrete frequency distribution if the data are presented in such a way that exact measurements of the units are clearly shown.
Continuous Frequency Distribution: A frequency in which data are arranged in classes groups which are not exactly measurable.
Statistics Formulas
The formulas that are commonly used in statistical analysis are given in the table below.
Representation of Data
There are different ways to represent data such as through graphs, charts or tables. The general representation of statistical data is:
Bar Graph
Pie Chart
Line Graph
Pictograph
Histogram
Frequency Distribution
Measures of Central Tendency
In Mathematics, statistics are used to describe the central tendencies of the grouped and ungrouped data. The three measures of central tendency are:
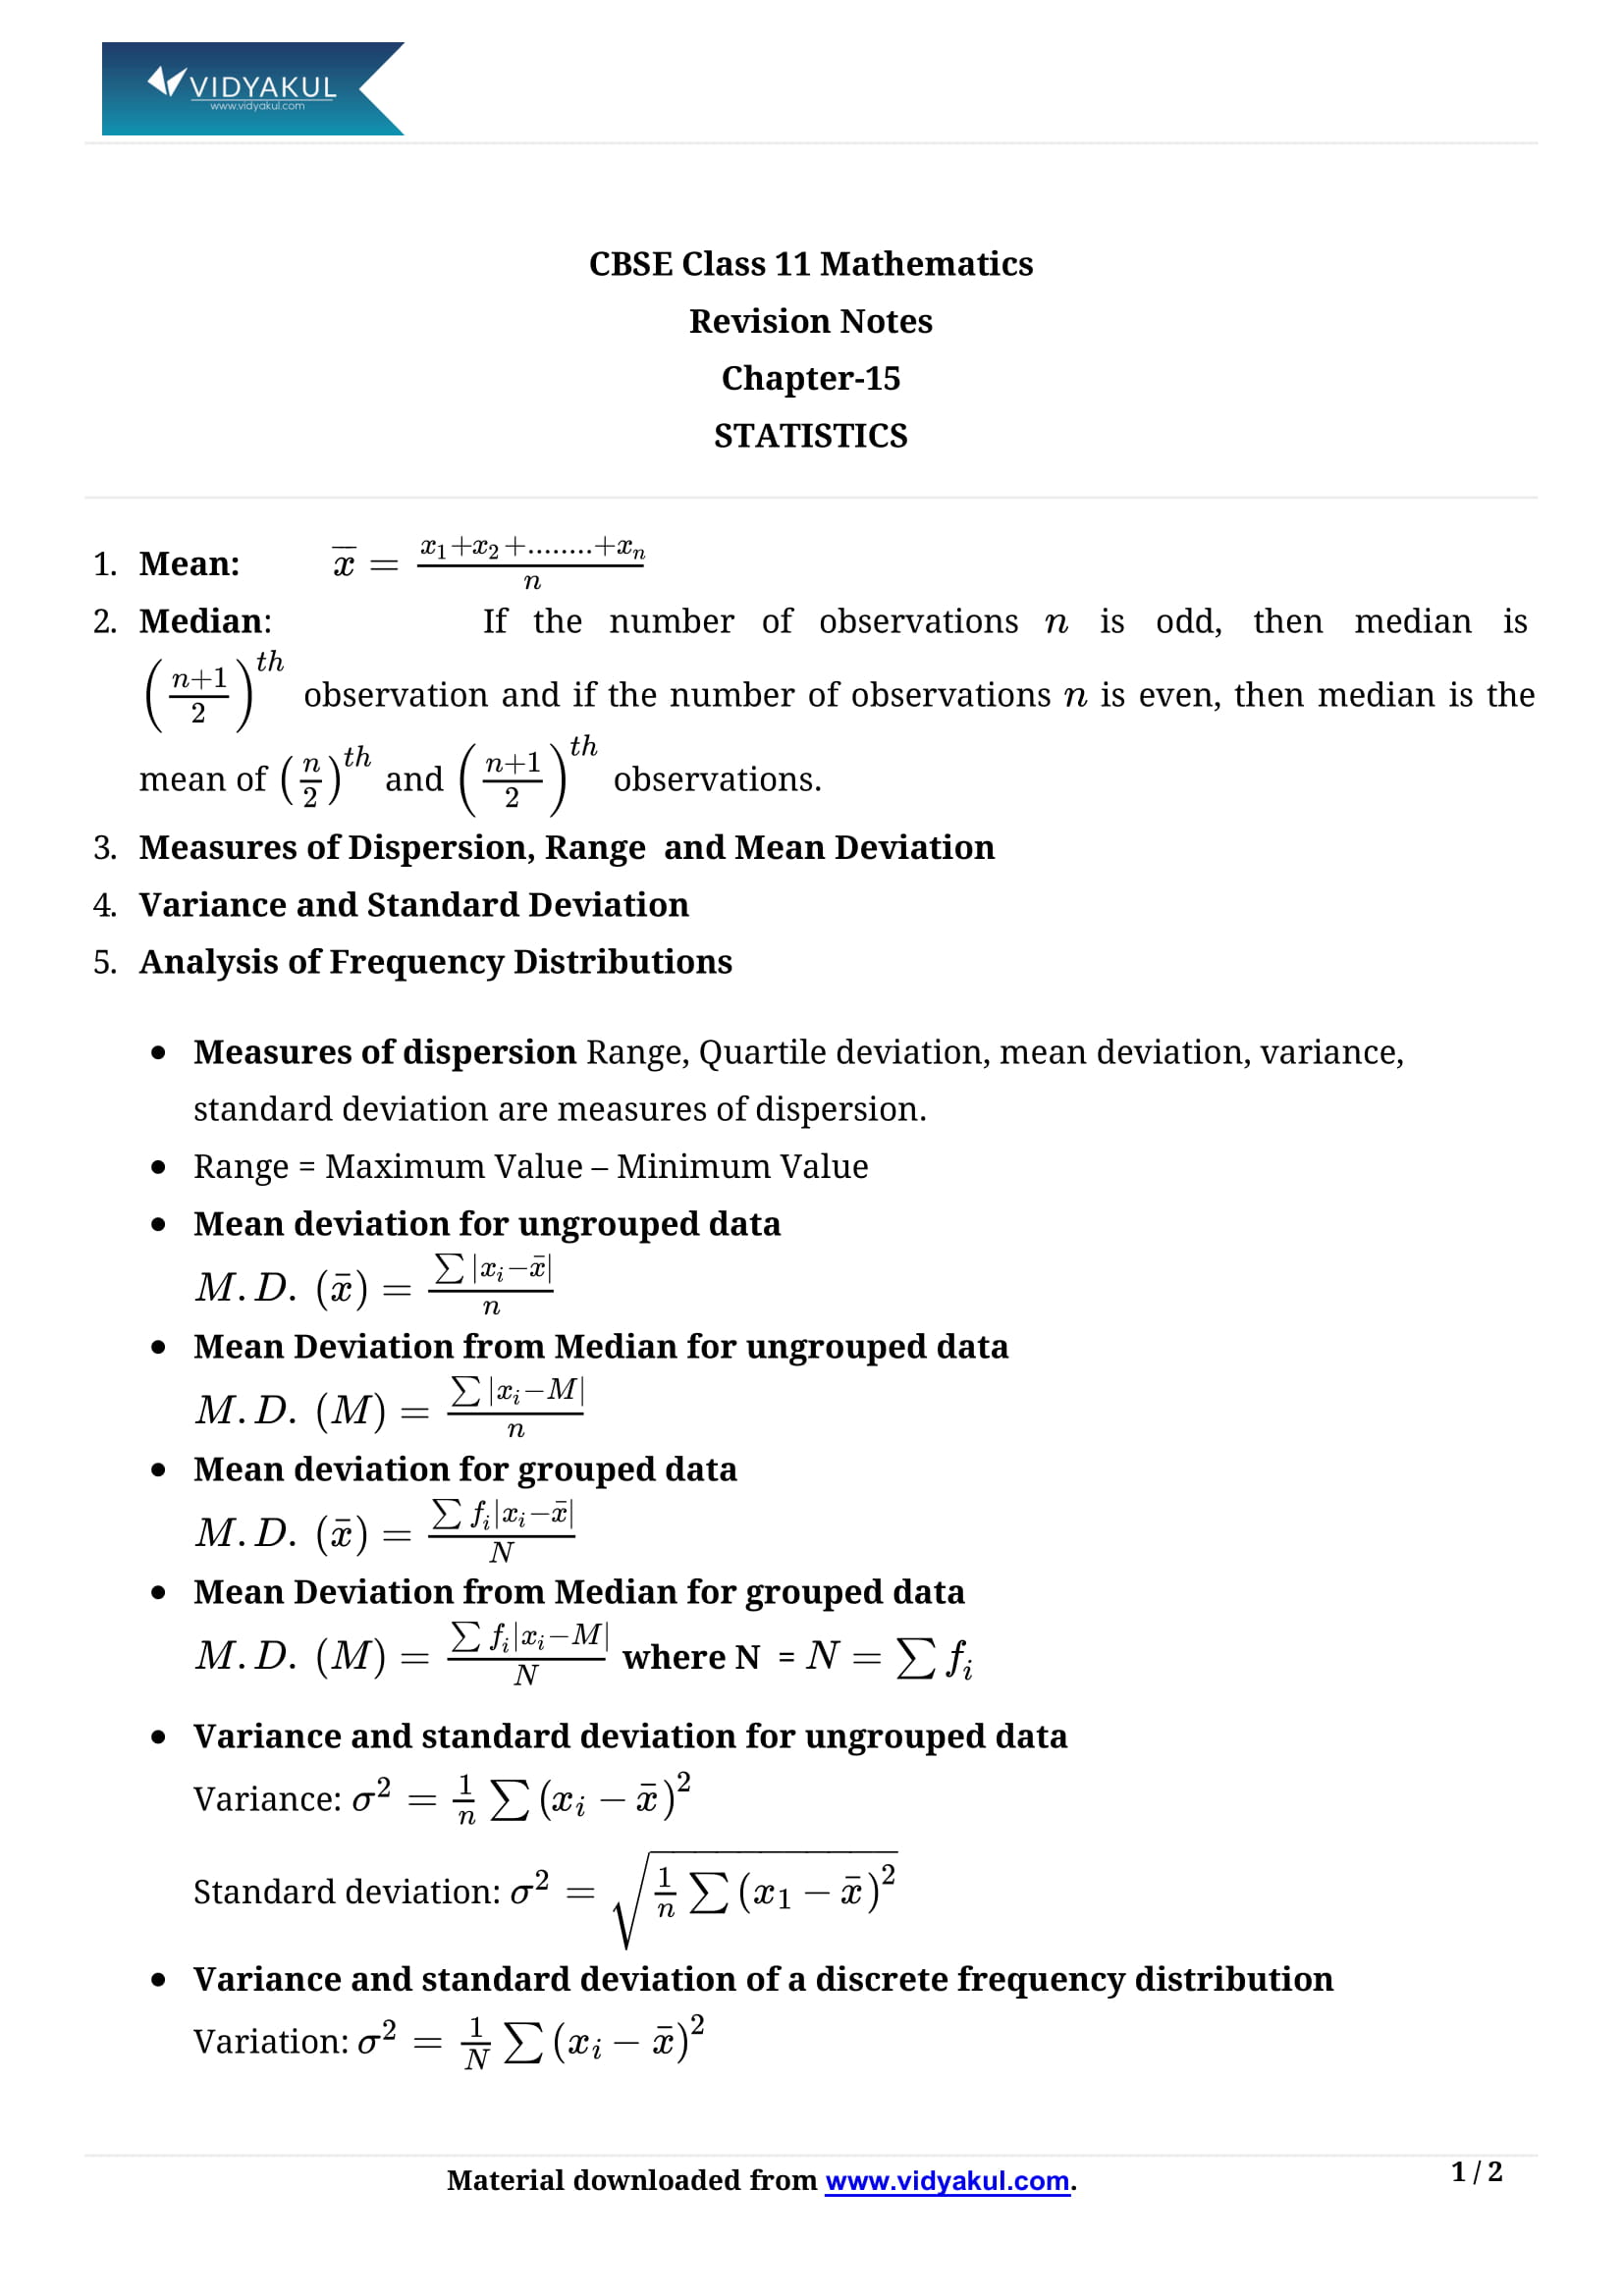
Mean
Median
Mode
All three measures of central tendency are used to find the central value of the set of data.
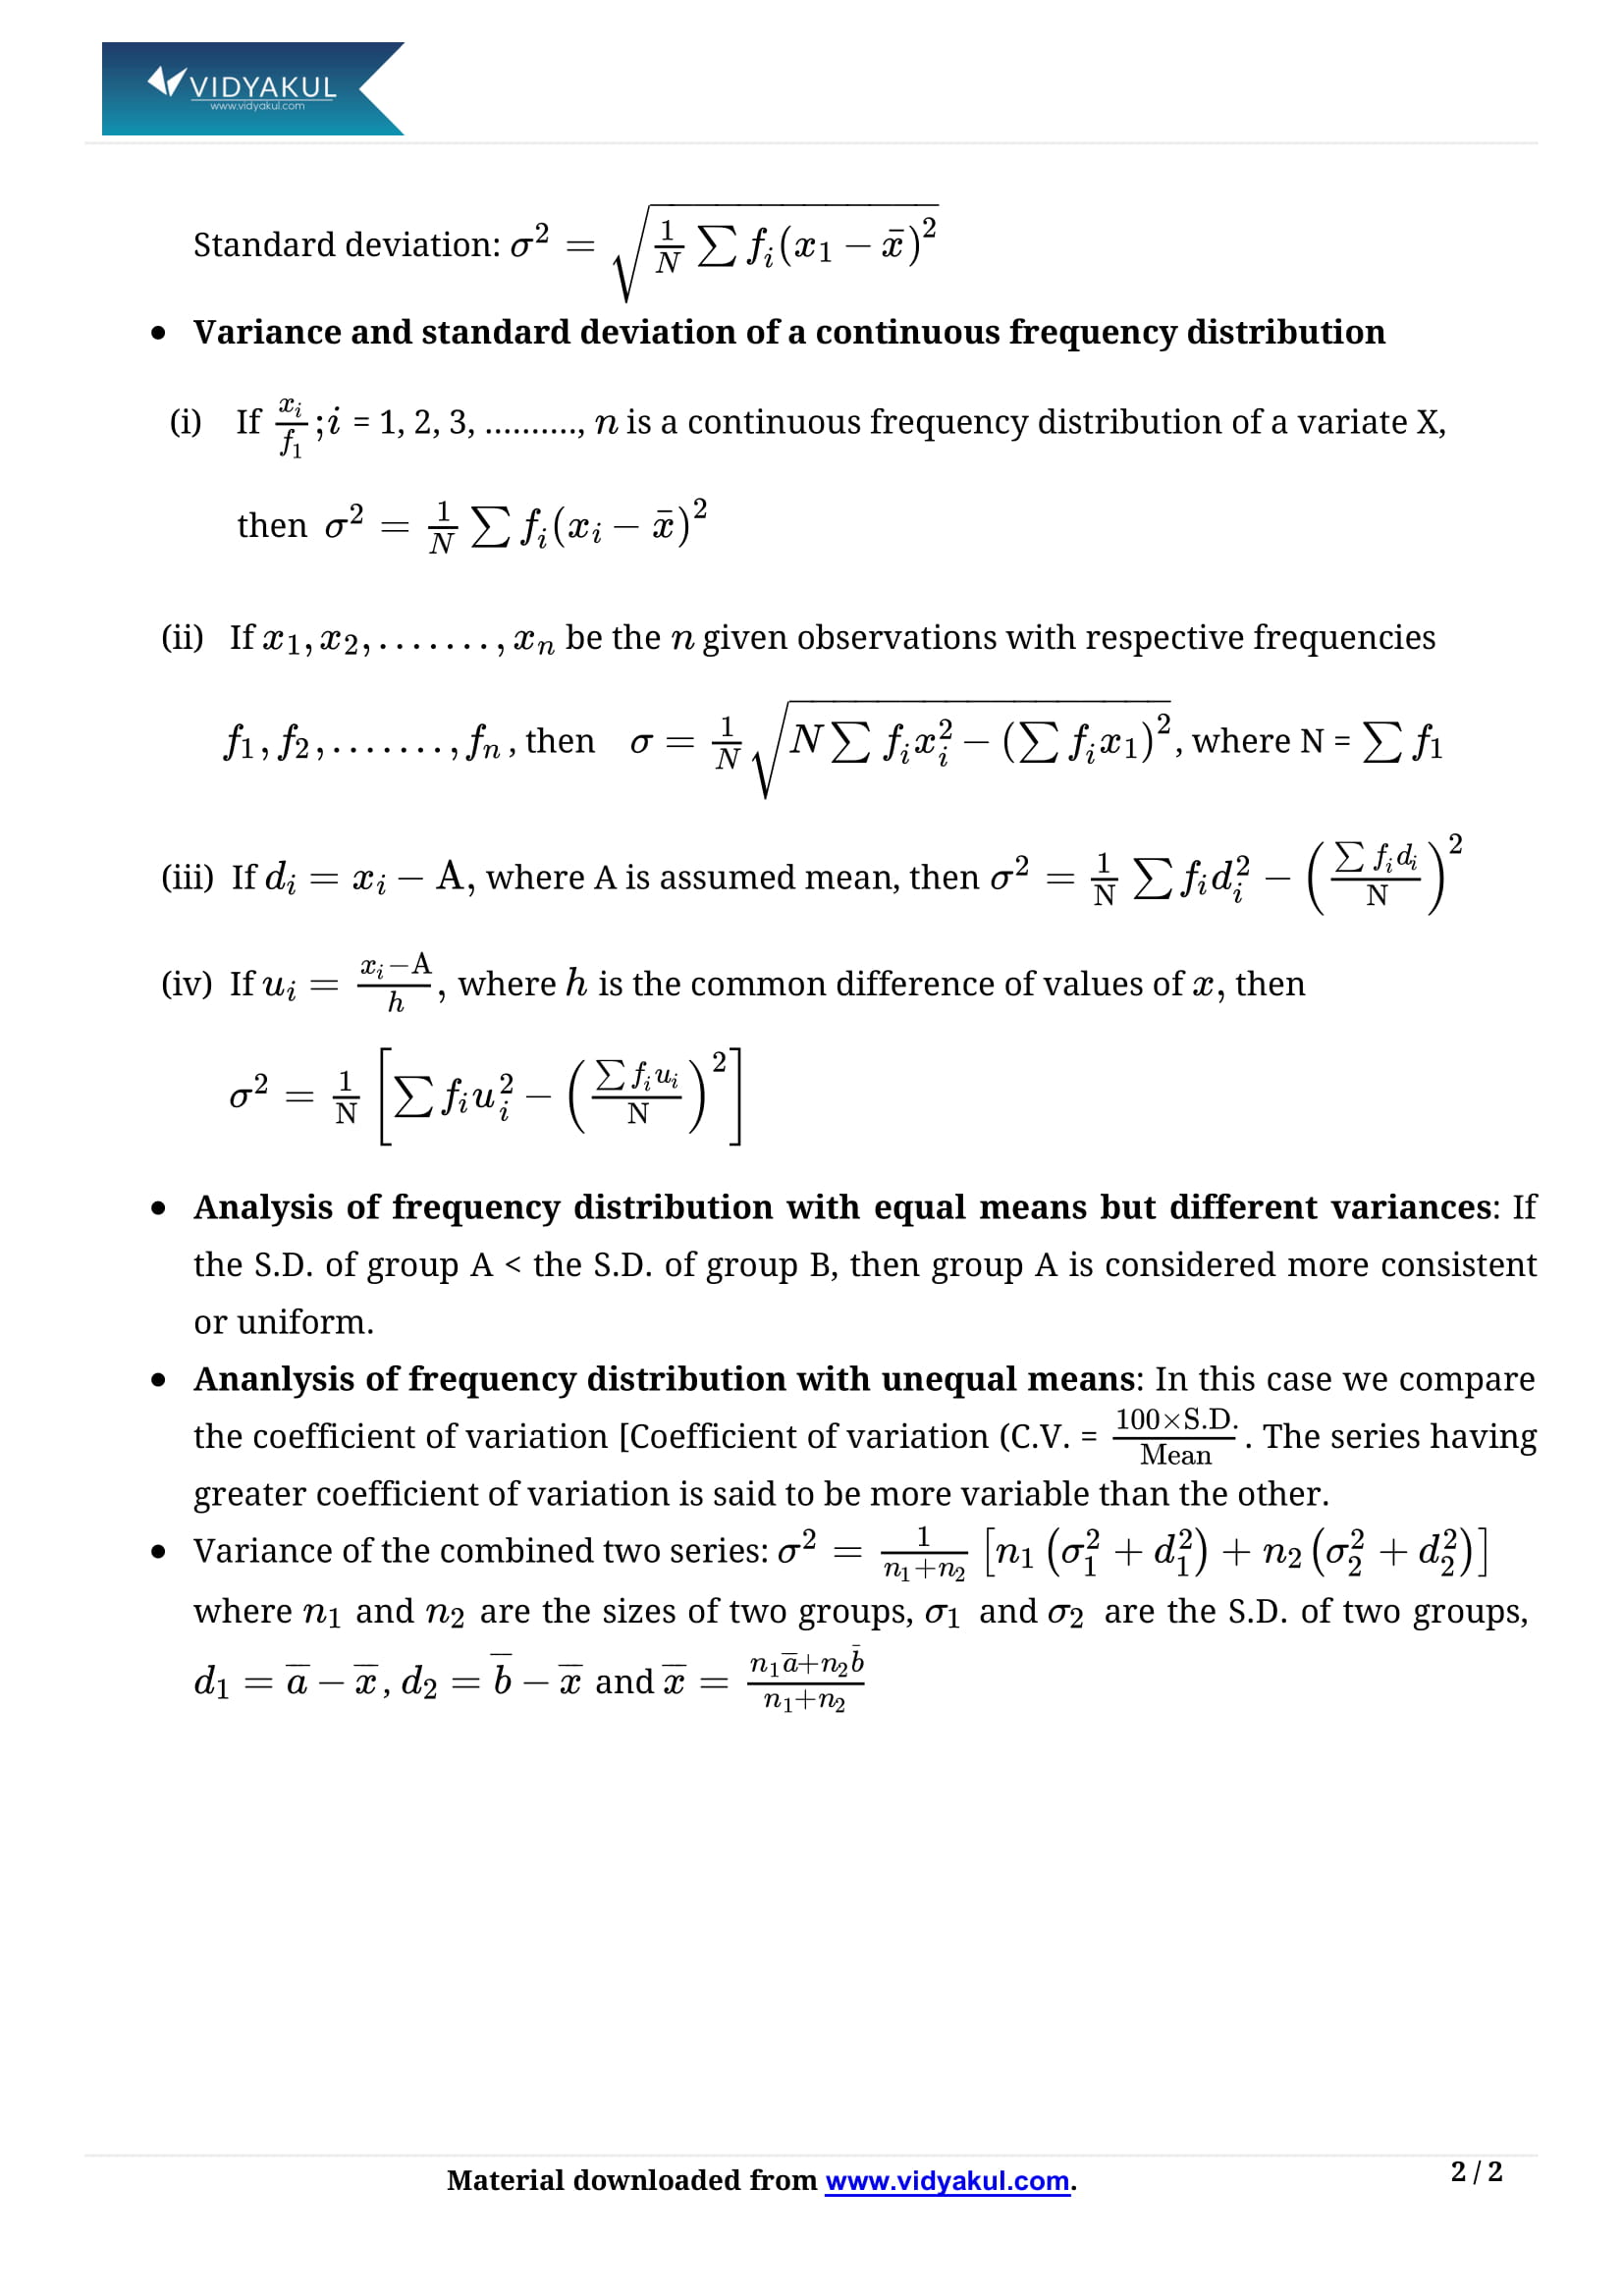
Measures of Dispersion
In statistics, the dispersion measures help interpret data variability, i.e. to understand how homogenous or heterogeneous the data is. In simple words, it indicates how squeezed or scattered the variable is. However, there are two types of dispersion measures, absolute and relative. They are tabulated as below:
Skewness in Statistics
Skewness, in statistics, is a measure of the asymmetry in a probability distribution. It measures the deviation of the curve of the normal distribution for a given set of data.
The value of skewed distribution could be positive or negative or zero. Usually, the bell curve of normal distribution has zero skewness.
ANOVA Statistics
ANOVA Stands for Analysis of Variance. It is a collection of statistical models, used to measure the mean difference for the given set of data.
Topics and Sub-topics
Before you get into the NCERT notes for Class 11 Math Chapter 15 – Statistics, let’s go through the sections included in this chapter:
Limit of the Class:
Class Interval:
Primary and Secondary Data:
Variable or Variate: A characteristics that vary in magnitude from observation to observation. E.g., weight, height, age, etc., are variables.
Frequency: The number of time an observation occurs in the given data, is called the frequency of the observation.
Discrete Frequency Distribution: A frequency distribution is called a discrete frequency distribution if the data are presented in such a way that exact measurements of the units are clearly shown.
Continuous Frequency Distribution: A frequency in which data are arranged in classes groups which are not exactly measurable.
Bar Graph
Pie Chart
Line Graph
Pictograph
Histogram
Frequency Distribution


Mean
Median
Mode
Learn more about the mean, median and mode in Statistics Class 11 Formulas & Notes pdf.
Download this solution for FREE Download this PDF
Download Vidyakul App for more Important notes, PDF's and Free video lectures.